Rookie Guide: How to Read a Company’s Balance Sheet Without Falling Asleep
Let’s be real for a second: if someone hands you a company’s balance sheet, your first reaction might be to yawn. Numbers in rows, fancy accounting terms, and that eternal mystery called shareholder equity—it’s enough to send most rookies straight to dreamland. But here’s the truth: a balance sheet isn’t some dusty relic. It’s a living snapshot of a company’s financial health—a selfie that shows what the business owns, what it owes, and what’s left for its shareholders. And once you know how to read it, you’ll find it’s less about boring bookkeeping and more about uncovering the hidden story behind a business. So, rookie, grab your coffee. Let’s make balance sheets not just bearable, but fun.
Mahalaxmi Ravichandran Vijayakumari
9/5/20254 min read

Balance Sheet Basics: The Three Buckets
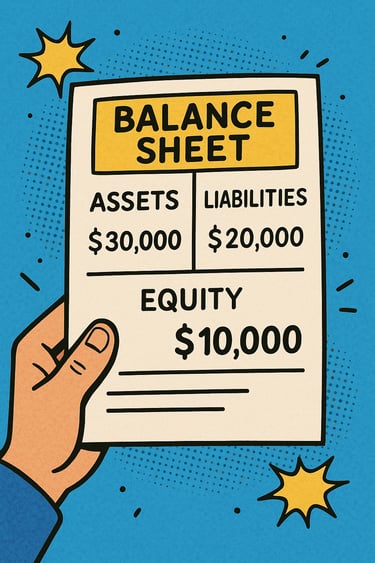
Every balance sheet is built on the same foundation:
Assets – What the company owns. Cash, inventory, factories, even that office coffee machine.
Liabilities – What the company owes. Think loans, unpaid bills, and other IOUs.
Equity – What’s left for the shareholders once all debts are settled.
The golden rule: Assets = Liabilities + Equity. Always.
Think of it like this: if a company were a pizza—
The crust and sauce are the assets.
The bills you paid to make it (dough, electricity, delivery fee) are the liabilities.
Whatever’s left on the plate for you to eat? That’s the equity.
Simple enough, right?
Assets: The Treasure Chest
Assets are divided into two main types:
Current Assets: These are things the company can turn into cash within a year—like cash itself, inventory, or customer payments due.
Non-Current Assets: The long-haul items—factories, patents, equipment, or real estate.
Why this matters: a company with strong current assets compared to current liabilities has wiggle room. If it’s the other way around, it might face a cash crunch.
Case in point: Walmart’s 2025 balance sheet showed nearly $56 billion in inventory—a mountain of goods waiting to be sold. Combine that with $9 billion in cash, and you can see Walmart’s strategy: pile stock high, keep the shelves full, and trust that the customers will come.
Liabilities: The IOUs
If assets are what you own, liabilities are the financial promises you’ve made.
Current Liabilities: Due within a year. These include supplier payments, short-term loans, or upcoming bills.
Non-Current Liabilities: The long-term stuff, like mortgages, bonds, or multi-year loans.
The rookie red flag here is debt overload. A company heavily reliant on debt is like someone maxing out three credit cards just to buy a PlayStation. It feels good short-term, but those interest payments can crush you later.
Case study: In 2025, Warner Bros. Discovery was flagged for its balance sheet stuffed with $25.9 billion of goodwill (intangible assets from acquisitions). The kicker? The company’s market value was trading 27% below its book value. Translation: Wall Street didn’t buy the story those assets were telling. And if a write-down happens? Expect fireworks in the financials.
Equity: The Leftovers (a.k.a. The Owners’ Slice)
Equity is what belongs to shareholders after debts are paid. It includes:
Share Capital – Money raised from investors.
Retained Earnings – Profits the company decided to keep and reinvest instead of paying out as dividends.
Tracking retained earnings is like checking a company’s savings account. If they’re growing, it’s a sign of long-term strength. If they’re flat—or worse, shrinking—it might mean profits are thin or being drained.
Case in point: Some companies look healthy on paper but hide cracks in equity. In early 2025, the John Wood Group admitted to “material weaknesses” in its financial reporting. The fallout? A nearly 30% plunge in its share price after it said it would restate three years of accounts. Lesson: don’t just trust the headline numbers—dig deeper.
Ratios: Your Rookie Toolkit
Okay, so you’re staring at the balance sheet. Where do you even start? Forget the noise. Zero in on these key ratios:
Current Ratio = Current Assets ÷ Current Liabilities
Measures short-term safety. Anything above 1 is usually healthy.
Debt-to-Equity Ratio = Total Liabilities ÷ Equity
Shows how much debt a company uses to fund itself. The higher it is, the riskier.
Price-to-Book Ratio = Market Cap ÷ Book Value of Equity
Tells you whether the stock market thinks the company is worth more or less than its accounting value.
These simple numbers can give you a snapshot of whether the company is thriving, surviving, or slowly drowning.
How to Actually Read a Balance Sheet (Without Losing Focus)
Here’s your four-step rookie playbook:
Start with the Structure: Separate assets, liabilities, and equity in your mind.
Look for Liquidity: Can the company cover its short-term debts with current assets?
Check Debt Levels: Is growth funded by stable equity or scary-high borrowing?
Spot Trends: Don’t just look at one year. Compare balance sheets over time—are assets growing, debt ballooning, or equity shrinking?
And don’t skip the footnotes. Companies often bury key details—like whether their cash is actually restricted or if that shiny asset is overvalued.
Why This Matters for You
If you’re investing, working at a startup, or just want to sound smart at networking events, reading a balance sheet is a superpower. It helps you:
See if a company is financially stable before investing.
Spot red flags early (before headlines break the news).
Understand the real health behind the buzzwords.
Balance sheets aren’t about memorizing every line—they’re about seeing the story. Is this a company that can weather storms? Or one that’s teetering on the edge?
Rookie Wrap-Up
Here’s the quick takeaway:
Balance sheet = financial X-ray.
Assets, liabilities, and equity are the three bones.
Ratios help you decode the story.
Case studies (Warner Bros., John Wood Group, Walmart) prove that even giants face risks hidden in plain sight.
So next time someone drops a balance sheet on your desk, don’t yawn. Lean in. You’re not looking at numbers—you’re uncovering a company’s DNA.
And who knows? You might even impress a few people at your next networking event by casually dropping, “Their current ratio looks solid, but I’m not loving that debt-to-equity trend.”
Stay tuned—next up, we’ll tackle “How to Read an Income Statement Without Drowning in Jargon.”